Plastic types #1 to #7: what each resin code means for your health and the bin
PET, HDPE, PVC, LDPE, PP, PS and the #7 grab bag: where each turns up, what leaches or sheds from it, how much actually gets recycled, and which to avoid.
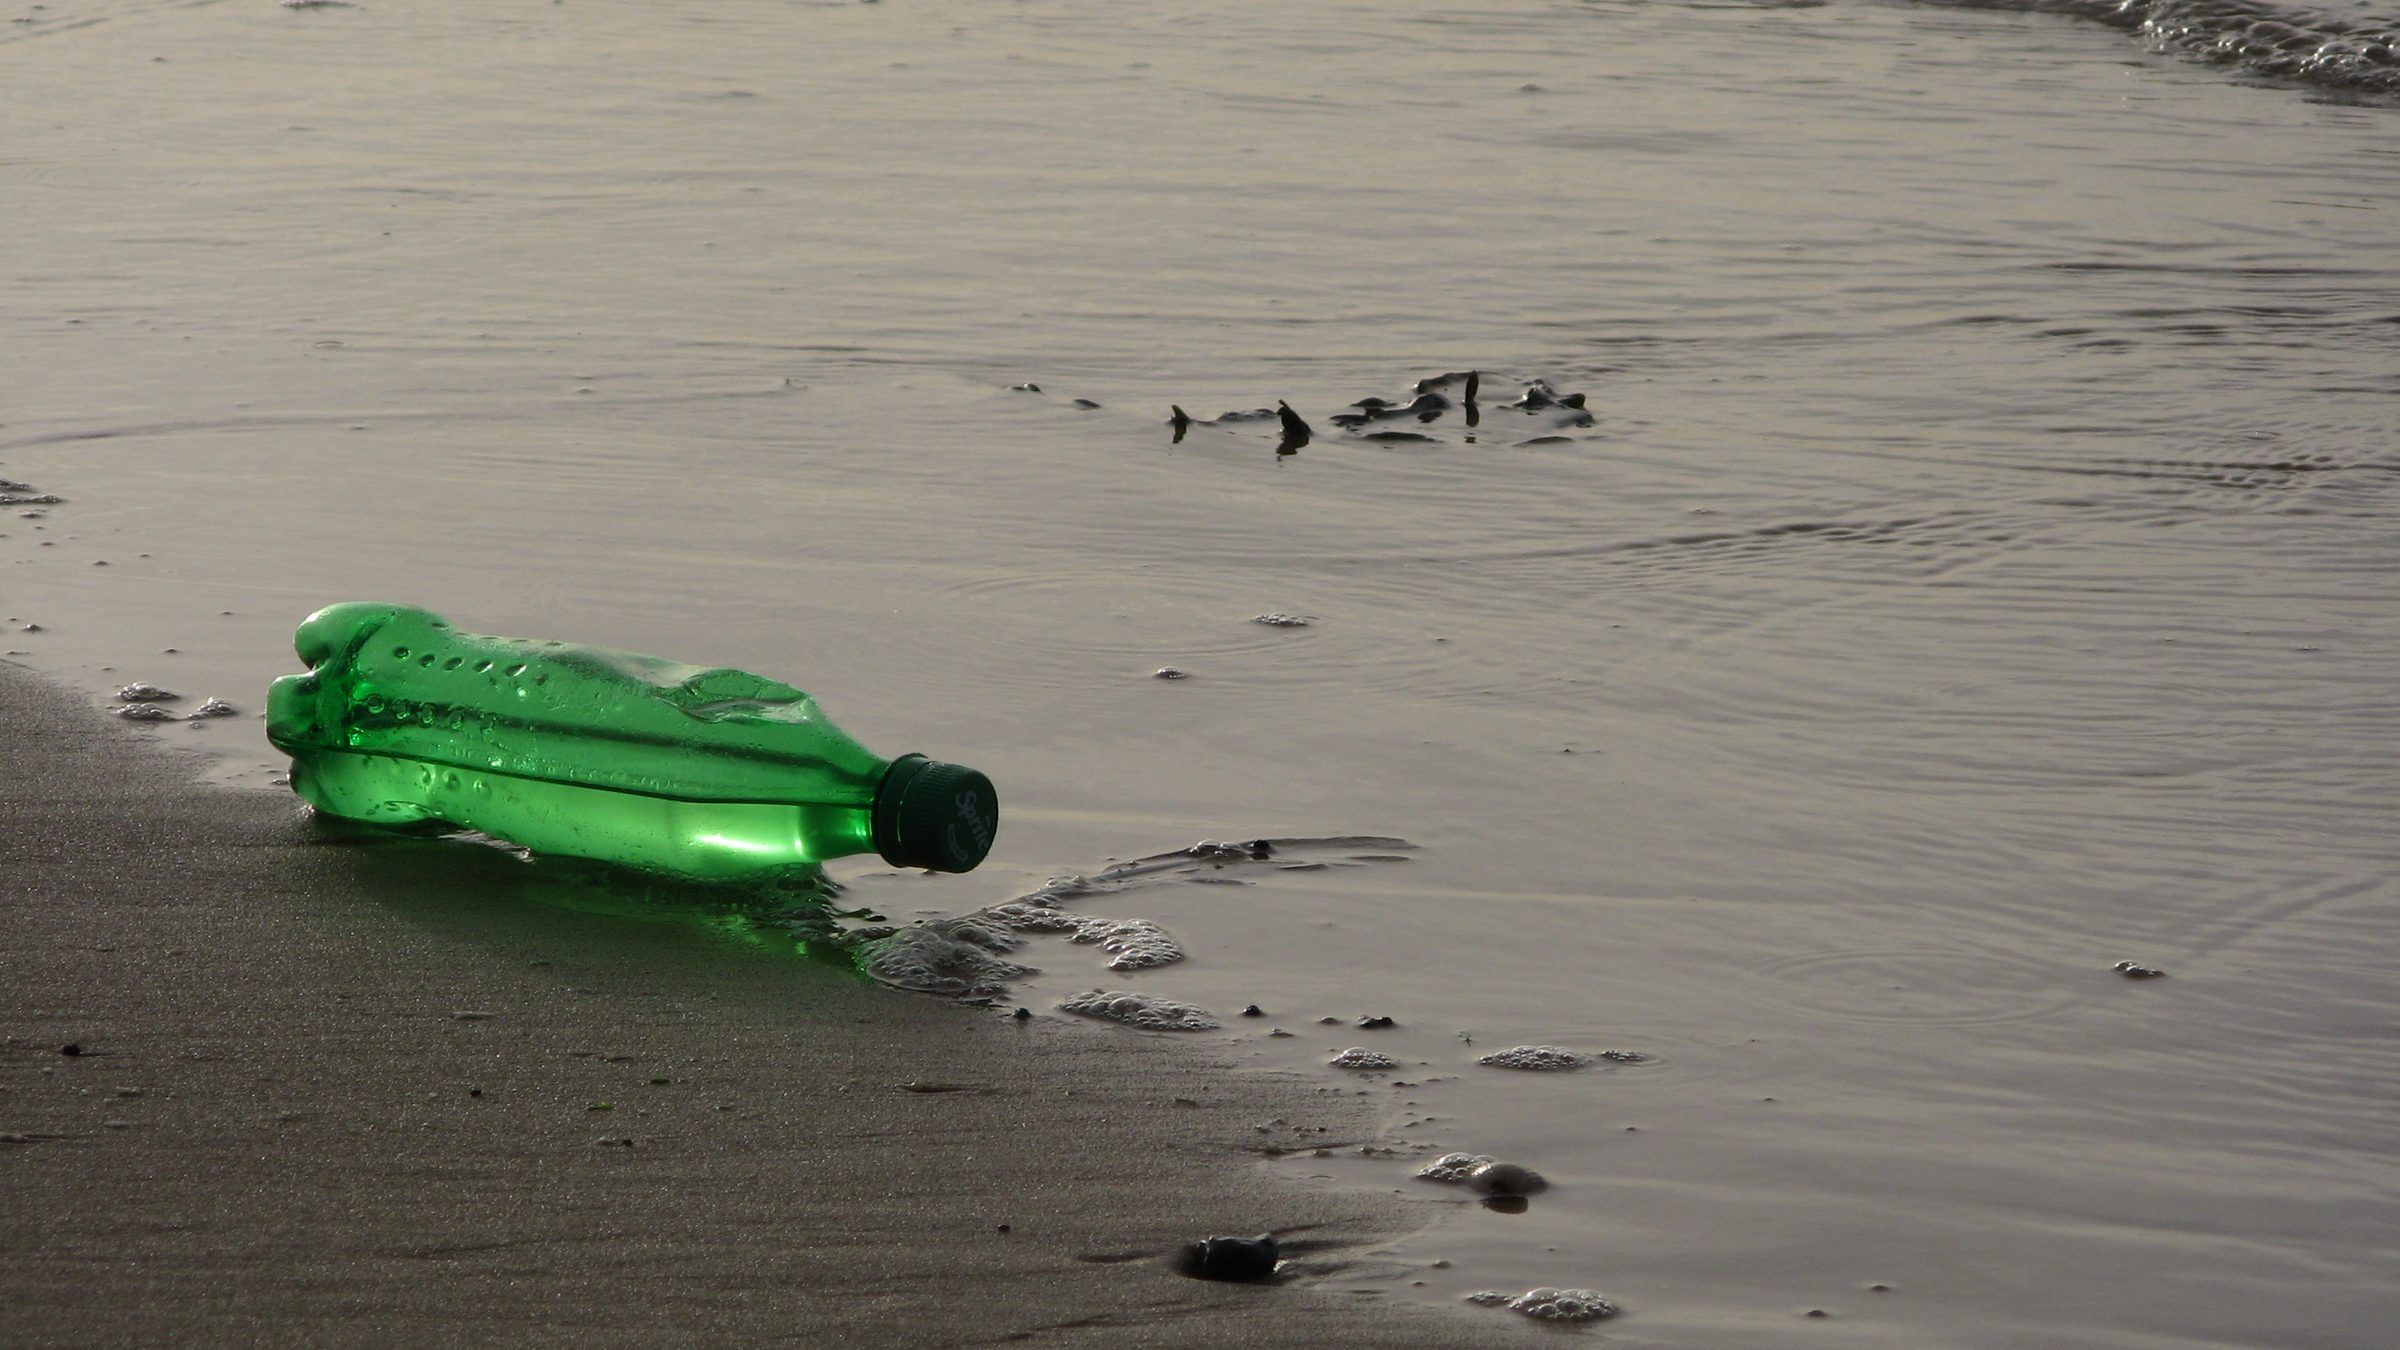
Flip over almost any plastic thing in your kitchen and you’ll find a little triangle with a number in it. Most people read it as an instruction: this one goes in the blue bin. It isn’t one. The number names the plastic, and for most of the seven codes the honest instruction would be “this is trash, and some of it you shouldn’t be heating your dinner in.”
Here is what each code actually is, what’s in it besides plastic, what comes off it, and what really happens to it after you throw it away.
The short version
US recycling rates are EPA’s most recent per-resin figures, for 2018 containers and packaging. “Negligible” means under 5,000 tons nationally.
| Code | Resin | Where you meet it | Main concern | US packaging recycled (2018) | Verdict |
|---|---|---|---|---|---|
| #1 | PET (polyethylene terephthalate) | Water and soda bottles, clamshells, polyester | Antimony and oligomers when hot; cap and neck shedding | 25.4% (bottles and jars 29.1%) | The least bad single-use plastic, which isn’t saying much |
| #2 | HDPE (high-density polyethylene) | Milk jugs, detergent and shampoo bottles | Unknown additives; few resin-specific red flags | 14.8% (natural bottles 29.3%) | Bottles sometimes recycled; everything else, rarely |
| #3 | PVC (vinyl) | Pipes, flooring, cling film, blister packs, toys, tubing | Phthalates, legacy lead, vinyl chloride | Negligible | Avoid, especially near food and kids |
| #4 | LDPE (low-density polyethylene) | Bags, film, squeeze bottles, cup linings | Nanoparticles from hot linings; high migration in some tests | 9.9% (bags, sacks, wraps 13.3%) | Assume it’s trash |
| #5 | PP (polypropylene) | Takeout tubs, yogurt cups, caps, baby bottles | Particle shedding and additive breakdown with heat | 2.7% | Fine cold; don’t heat food in it |
| #6 | PS (polystyrene) | Foam cups and clamshells, disposable cutlery, CD cases | Styrene, a probable human carcinogen | 3.6% | Avoid, especially with hot food |
| #7 | Other: polycarbonate, PLA, nylon, acrylic, ABS, mixtures | Old water jugs, “compostable” cups, kitchen tools, toys | Depends: BPA, flame retardants, aromatic amines | Negligible | Not a material, a shrug |
Where the numbers came from
The codes were built for the recycling industry, not for shoppers. The Society of the Plastics Industry, the industry’s trade group, launched them in 1988 at the urging of recyclers, as a way to tell sorters and manufacturers which resin they were holding. SPI began working with the standards body ASTM International on updating and maintaining the codes in 2008, and the system became ASTM D7611 in 2010.
For its first 25 years the number sat inside a loop of chasing arrows, the universal symbol for recycling. In 2013 ASTM changed that. The revised standard specifies a solid equilateral triangle around the number, because, in ASTM’s words, the code is “solely dedicated to identifying resin content, rather than product recyclability.” A New York City Sanitation official on the committee put it more bluntly: the change “decouples the RIC system from the recycling message, which has been a significant source of confusion by the public.” The current standard says plainly that resin codes are not “recycle codes”.
Thirteen years later, you’ll still find arrows on plenty of packaging. Why the arrows went on in the first place, and what the industry knew about plastic recycling while it lobbied for them, is its own story: read is plastic recycling a myth?
The same 2013 announcement said ASTM was looking at separate codes for PLA, polycarbonate, ABS and nylon, which still share #7. In the US they still do.
How to read a recycling rate
Three numbers get quoted, and they measure different things.
- EPA’s rate is tons recycled divided by tons generated. EPA’s latest per-resin breakdown is for 2018. Across all products it found 8.7% of plastic recycled, and for packaging, 13.6%. Its “other resins” line shows 26.7%, but that’s an accounting bucket for recycling EPA couldn’t assign to any resin, not a sign that #7 plastics get recycled. Its #7 packaging line is negligible.
- Industry collection rates count what’s collected for recycling, not what’s made into something new. The PET trade group NAPCOR reports a 30.2% US PET bottle rate for 2024, down from 32.5% in 2023.
- Reprocessing estimates try to count what is actually turned back into material. Greenpeace USA estimated that in 2021 PET was reprocessed at 20.9% and HDPE at 10.3%, and every other type at under 5%. That’s an advocacy group’s estimate, not an official statistic.
Meanwhile “recyclable” on a label is a legal claim with a low bar. Under the FTC’s Green Guides, an unqualified recyclable claim needs collection available to at least 60% of consumers or communities. Being accepted somewhere is not the same as being recycled. A 2020 Greenpeace survey of US facilities concluded that only some PET #1 and HDPE #2 bottles and jugs could legitimately carry the word.
One more caveat before the codes. The resin is only the start. A 2021 inventory found more than 10,000 chemicals used as plastic monomers, additives and processing aids, with over 2,400 meeting EU criteria for potential concern, and 901 of those approved for food-contact plastics somewhere. Two products with the same number can contain very different things, and labels don’t tell you which.
#1 PET (polyethylene terephthalate)
Where it’s found
Single-use water and soda bottles, salad and berry clamshells, peanut butter jars, and, spun into fibre, polyester clothing.
What’s in it, and what comes out
Antimony. PET contains antimony, and some of it leaches. In a study of nine bottled waters in Arizona, levels were 0.095 to 0.521 parts per billion, far below EPA’s drinking-water limit of 6 ppb. Heat changed that: the model the researchers fitted predicted the limit would be exceeded after 38 days at 65°C and 4.7 days at 75°C. The authors note that summer temperatures inside Arizona cars and garages can exceed 65°C. Leaving a case of water in the car in July is the version of this that matters.
Oligomers. Microwaving a PET tray caused faster migration of cyclic oligomers (short chains of the polymer) into food simulants than conventional heating at the same temperature, though total migration stayed within EU limits.
Particles. Opening and closing a bottle 1, 10 and 100 times steadily increased surface microplastics on the PET neck and especially the HDPE cap, while squeezing the bottle didn’t significantly raise particle counts in the water. That fits an earlier survey of 259 bottles in which the most common confirmed polymer was polypropylene (54%), matching the caps, not PET. Newer imaging estimated about 240,000 particles per litre of bottled water, 90% of them nanoplastics, though that method has been criticised over its blanks.
On the plus side, a 2024 screen of reusable bottles found PET among the materials with minimal chemical migration.
Recycling reality
The best of a bad lot. EPA put 2018 PET bottle and jar recycling at 29.1%, and all PET packaging at 25.4%. NAPCOR’s bottle figure has hovered around 30% for a decade, and even in 2023 recycled PET made up only about 16% of the material in US bottles. Only 59% of the recycled PET used in US and Canadian markets that year went back into bottles. Fibre is one of the other destinations; for what polyester does after that, see synthetic clothes shed microplastics.
Verdict: The least bad single-use plastic. Keep it cool, don’t microwave it, and buy fewer of them.
#2 HDPE (high-density polyethylene)
Where it’s found
Milk and juice jugs, detergent and shampoo bottles, bottle caps, cutting boards, some grocery bags and cereal liners.
What’s in it, and what comes out
HDPE has no infamous signature chemical, which is not the same as having none. In the 2024 reusable-bottle screen, HDPE and LDPE bottles were among those with the highest migration, alongside silicone and PP, with most of the nearly 1,000 unidentified compounds unique to a single bottle. HDPE caps also abraded with repeated opening in the bottle-cap study.
Recycling reality
Natural (unpigmented) HDPE bottles were recycled at 29.3% in 2018; all HDPE packaging at 14.8%, and HDPE across every product at 8.9%. Greenpeace estimated actual reprocessing at 10.3%.
Verdict: A bottle has a real but minority chance of being recycled; anything else made of HDPE, much less. Low concern, not no concern.
#3 PVC (polyvinyl chloride, vinyl)
Where it’s found
Pipes, window frames, vinyl flooring, shower curtains, blister packs, some cling films, garden hoses, faux leather, older toys, and the tubing and gaskets in food processing.
What’s in it, and what comes out
PVC is the plastic most likely to arrive with a chemistry set attached.
Phthalates. The FDA says phthalates are used most commonly in PVC to make it soft. The US bans eight of them above 0.1% in children’s toys and child care articles. The EU restricts four in most consumer articles since 2020. Food is a big exposure route: in national US data, the heaviest fast-food eaters had 23.8% higher DEHP metabolites. That’s an association, and it doesn’t single out PVC. The FDA says phthalate use in food contact is now limited and exposure is falling, but it still permits nine.
Lead. Lead compounds were long used to stabilise PVC. The EU banned lead at 0.1% or more in PVC from November 2024, noting that 90% of lead emissions from PVC articles in the EU in 2016 came from imports. The catch tells you everything about plastic recycling: recovered rigid PVC with up to 1.5% lead may still be used in certain building products until 2033, labelled “Contains ≥ 0,1 % lead.” Recycling PVC recycles its old additives too.
Vinyl chloride. PVC is made from vinyl chloride, which IARC classifies as carcinogenic to humans (Group 1): it causes a rare liver cancer, angiosarcoma, in exposed workers. That’s a hazard for people making PVC, not for people using a shower curtain, but it’s part of the price.
Recycling reality
Negligible: under 5,000 tons of PVC was recycled nationally in EPA’s 2018 data, from 840,000 tons generated.
Verdict: The resin to avoid first, especially for anything soft, anything a child mouths, and anything that touches fatty food.
#4 LDPE (low-density polyethylene)
Where it’s found
Grocery and bread bags, produce bags, cling film, squeeze bottles, six-pack rings, and the plastic lining inside “paper” cups and cartons.
What’s in it, and what comes out
Hot water poured into LDPE-lined beverage cups released more than a trillion nanoparticles per litre in a NIST lab study. And LDPE bottles were among the higher-migration materials in the reusable-bottle screen. Neither shows harm in people; both show that “inert” plastic isn’t. More on cups in tea bags and coffee cups.
Recycling reality
EPA counted 13.3% of LDPE bags, sacks and wraps as recycled in 2018 and 9.9% of all LDPE packaging; across all products, 4.3%.
Verdict: Assume it’s trash. Bring your own bag and keep film away from hot food.
#5 PP (polypropylene)
Where it’s found
Takeout and deli tubs, yogurt cups, bottle caps, most “microwave-safe” storage containers, baby bottles, straws, and the non-woven fabric in tea bags and masks.
What’s in it, and what comes out
PP is the plastic most often sold for heating, and the one with the most evidence that heating it is a bad idea.
- Particles. PP infant bottles released up to 16.2 million microplastics per litre during formula preparation, with sterilising and hotter water increasing release, though another lab using the same method found almost nothing and suspects additives were counted as particles. PP baby-food containers released the most particles when microwaved. In a test of takeout containers with hot water, PP shed more than PET or PLA, second only to polystyrene.
- Additives. Microwaving PP in fatty food simulants broke down its antioxidant additives, increasing migration in a way conventional heating at the same temperature didn’t. Reusable PP bottles leached clarifying agents and bisphenol A derivatives.
All of this is lab work on release, not evidence of harm in people. For the full story see is it safe to microwave plastic? and baby bottles and microplastics.
Recycling reality
EPA counted 2.7% of PP packaging as recycled in 2018 (0.6% across all products, an undercount partly because caps collected with PET bottles are tallied under PET). Greenpeace put reprocessing of everything beyond #1 and #2 at under 5%.
Verdict: Fine for cold storage. Never the thing you heat food or formula in, whatever the label says.
#6 PS (polystyrene)
Where it’s found
Foam cups, clamshells and meat trays (expanded polystyrene), disposable cutlery and cups (rigid PS), yogurt pots in some countries, packing peanuts, and coat hangers.
What’s in it, and what comes out
Styrene. IARC classifies styrene as probably carcinogenic to humans (Group 2A), mainly on evidence from workers and animals, and notes that styrene in packaged food is “reported to be primarily due to monomer migrating from polystyrene containers.” General-population intake is orders of magnitude below worker exposure, but most people have measurable styrene in their blood. FDA scientists who tested 24 PS products found styrene at 2.6 to 163 ng/g in foods in contact with PS packaging, levels not significantly changed since the 1980s; styrene in the packaging itself was within FDA limits. That last part cuts both ways: the exposure is low, and nobody has removed it in 40 years.
Particles. Rough-surfaced PS takeout containers carried the most microplastics of those tested in one study, and PS shed the most of four plastics filled with hot water.
Flame retardants. Black plastic kitchenware made from styrene-based plastics carried more flame retardants than PP or nylon, a sign of recycled electronics casings in food-contact goods. That paper was corrected twice for an exposure calculation; this finding stands. See black plastic utensils.
Recycling reality
3.6% of PS packaging in 2018; 0.9% overall.
Verdict: Avoid. Hot coffee in a foam cup is the textbook case of what not to do.
#7 Other
Seven isn’t a plastic. It covers every resin without its own number, plus multilayer mixtures. After the 2013 revision an ASTM task group began looking at labelling the main ones separately; in the US they still share #7. EPA recorded negligible recycling of “other resin” packaging and of PLA in 2018. Here are the members you’re most likely to meet.
Polycarbonate (PC)
Hard, clear and shatterproof: five-gallon water-cooler jugs, older reusable bottles and baby bottles, food-processor bowls, eyeglass lenses. Polycarbonate is made from bisphenol A. Boiling water increased BPA release from PC bottles up to 55-fold, and PC baby bottles put through 51 dishwasher cycles released 8.4 µg/L of BPA versus 0.23 µg/L when new. The FDA still calls BPA safe at current levels, though it ended PC baby bottles in 2012 after industry said it had stopped making them. Europe went the other way: EFSA cut its tolerable daily intake to 0.2 nanograms per kilo of body weight, concluding that typical exposures exceed it by two to three orders of magnitude, and in December 2024 the EU adopted a ban on BPA in food-contact materials with an 18-month phase-out.
Its “BPA-free” replacements, such as Tritan copolyester, are also stamped #7. In one lab screen, many Tritan, acrylic and polystyrene products still leached estrogenic chemicals; the authors work for and own stock in CertiChem, the lab that ran the assays.
Verdict: Retire old polycarbonate, especially anything that sees hot water or the dishwasher.
PLA (polylactic acid)
The “compostable” plastic in clear cold cups, cutlery and cup linings. It’s made from plants, but it’s still plastic. PLA shed the fewest particles of four takeout plastics in hot water, but a lab screen of bio-based products including PLA found them similarly toxic to conventional plastics in cell tests. It breaks down in industrial composters, not in your bin, and in a recycling stream it’s a contaminant. See compostable plastics.
Verdict: A label, not a solution. Better than PS for a cold drink; not something to feel good about.
Nylon (polyamide)
Black spatulas and slotted spoons, food-grade cooking bags, tea bags in some brands. Food-grade nylon bags in hot water released over a trillion nanoparticles per litre, about seven times more than LDPE-lined cups. Nylon cooking utensils are also a known source of primary aromatic amines, which the researchers describe as a health risk. By the researchers’ count, those amines were the subject of 25.1% of notifications to the EU’s food safety alert system from 2010 to 2015, with polyamide utensils a common source.
Verdict: Swap nylon tools for wood or stainless steel, the cheapest fix on this page.
Acrylic (PMMA)
Clear “glass-look” tumblers, picnicware, display boxes. It’s rarely used for heating, and evidence on food contact is thin. In the same lab screen, run by a testing firm the authors own stock in, many acrylic products leached estrogenic chemicals.
Verdict: Probably low risk for cold drinks; don’t put it in the dishwasher or microwave.
ABS (acrylonitrile butadiene styrene)
Lego-type bricks, appliance and electronics housings, luggage, some kitchen gadgets. ABS is built from two monomers on IARC’s lists: acrylonitrile, classified as carcinogenic to humans (Group 1) in 2024 (the general public is exposed mainly through tobacco smoke), and styrene (Group 2A). The bigger documented problem is recycling. Studies of black food-contact items and toys found brominated flame retardants from electronic waste concentrated in ABS and other styrene-based plastics, and in one set of 26 samples, 45% of the bromine-positive items had decaBDE above the limits for PBDEs, mostly in ABS.
Verdict: Fine for toys and housings, as long as it isn’t recycled electronics plastic turning up in your kitchen. You usually can’t tell, which is the problem.
What actually lowers your exposure
Ranked by the strength of the evidence, strongest first.
- Don’t heat food or drink in plastic. Every resin above releases more when hot. It’s the most consistent finding in the lab literature. The human evidence is indirect, from cutting packaging rather than heat: when 20 people ate fresh food stored in glass for three days, BPA fell 66% and DEHP metabolites by more than half.
- Keep #3, #6 and old polycarbonate away from food, especially hot, fatty or acidic food. These are the resins with a named chemical of concern behind them, not just general unease.
- Replace scratched, cloudy or dishwasher-worn containers. Wear increases release, as the polycarbonate bottle data show.
- Swap black plastic and nylon kitchen tools for wood or steel. It’s cheap, and the flame-retardant and amine findings are real even if the risk numbers are debated.
- Store in glass or stainless steel. This is where the evidence runs out: there’s no study showing it improves health, only that it removes the exposure.
Choosing #2 over #5 for a cold leftover matters far less than any of these.
What’s still unknown
- What’s in a given product. With more than 10,000 possible chemicals and no disclosure requirement, the resin code tells you the polymer, not the recipe.
- Whether particle shedding harms people. Release studies are lab measurements, often of particle counts that don’t agree with each other, and the nanoplastic numbers are still being argued over. For the human evidence so far, see microplastics are inside you right now.
- What recycled plastic carries. The FDA reviews recycled food-contact plastics case by case because contaminants can come along for the ride; the EU’s lead-in-PVC exemption and the flame retardants in recycled black plastic show it happening.
- Whether recycling will ever scale. After 38 years of numbered triangles, two codes get recycled at meaningful rates and five essentially don’t. The number on the bottom was never going to fix that. Buying less plastic will.
Sources
- ASTM International (2013). ASTM Plastics Committee Releases Major Revisions to Resin Identification Code (RIC) Standard. ASTM press release, 11 June 2013.
- Clauson D (2016). Modernizing the Resin Identification Code. ASTM Standardization News, 26 July 2016.
- ASTM International, Committee D20 (2021). ASTM D7611/D7611M-21: Standard Practice for Coding Plastic Manufactured Articles for Resin Identification. ASTM International.
- US Environmental Protection Agency (2020). Advancing Sustainable Materials Management: Facts and Figures 2018, Tables and Figures. EPA, December 2020.
- Greenpeace USA (2022). New Greenpeace Report: Plastic Recycling Is A Dead-End Street (press release for Circular Claims Fall Flat Again). Greenpeace USA, 24 October 2022.
- Hocevar J (Greenpeace USA) (2020). Circular Claims Fall Flat: Comprehensive U.S. Survey of Plastics Recyclability. Greenpeace USA report, 18 February 2020.
- National Association for PET Container Resources (NAPCOR) (2025). NAPCOR Releases 2024 PET Recycling Report Highlighting System Efficiency Gains and Continued Strength of PET Circularity. NAPCOR press release, December 2025.
- National Association for PET Container Resources (NAPCOR) (2024). 2023 US PET Bottle Recycling Rate Reaches Highest Level in Decades; Recycled PET Content in US Bottles Reaches Highest Level Ever. NAPCOR press release, 12 December 2024.
- US Federal Trade Commission (2012). Guides for the Use of Environmental Marketing Claims, 16 CFR 260.12 (Recyclable claims). Code of Federal Regulations (via Cornell LII).
- Wiesinger H, Wang Z, Hellweg S (2021). Deep dive into plastic monomers, additives, and processing aids. Environmental Science & Technology.
- Westerhoff P, Prapaipong P, Shock E, Hillaireau A (2008). Antimony leaching from polyethylene terephthalate (PET) plastic used for bottled drinking water. Water Research.
- Alin J, Hakkarainen M (2013). Combined chromatographic and mass spectrometric toolbox for fingerprinting migration from PET tray during microwave heating. Journal of Agricultural and Food Chemistry.
- Winkler A, Santo N, Ortenzi MA, Bolzoni E, Bacchetta R, Tremolada P (2019). Does mechanical stress cause microplastic release from plastic water bottles?. Water Research. Our summary
- Mason SA, Welch VG, Neratko J (2018). Synthetic polymer contamination in bottled water. Frontiers in Chemistry. Our summary
- Qian N, Gao X, Lang X, Deng H, Bratu TM, Chen Q, Stapleton P, Yan B, Min W (2024). Rapid single-particle chemical imaging of nanoplastics by SRS microscopy. Proceedings of the National Academy of Sciences. Our summary
- Materić D (2024). Nanoplastics measurements must have appropriate blanks. Proceedings of the National Academy of Sciences (letter).
- Tisler S, Kristiansen N, Christensen JH (2024). Chemical migration from reusable plastic bottles: silicone, polyethylene, and polypropylene show highest hazard potential in LC-HRMS analysis. Journal of Hazardous Materials.
- US Food and Drug Administration (2026). Phthalates in Food Packaging and Food Contact Applications. FDA (Food Additives and GRAS Ingredients, Information for Consumers).
- IARC Working Group on the Evaluation of Carcinogenic Risks to Humans (2012). Chemical Agents and Related Occupations (IARC Monographs Volume 100F): Vinyl chloride. International Agency for Research on Cancer.
- European Commission (2023). Commission Regulation (EU) 2023/923 amending Annex XVII to REACH as regards lead and its compounds in PVC. Official Journal of the European Union L 123, 8 May 2023.
- European Commission (2018). Commission Regulation (EU) 2018/2005 amending Annex XVII to REACH as regards DEHP, DBP, BBP and DIBP. Official Journal of the European Union L 322.
- US Consumer Product Safety Commission (2018). 16 CFR Part 1307: Prohibition of children's toys and child care articles containing specified phthalates. Electronic Code of Federal Regulations.
- Zota AR, Phillips CA, Mitro SD (2016). Recent fast food consumption and bisphenol A and phthalates exposures among the U.S. population in NHANES, 2003-2010. Environmental Health Perspectives.
- Zangmeister CD, Radney JG, Benkstein KD, Kalanyan B (2022). Common single-use consumer plastic products release trillions of sub-100 nm nanoparticles per liter into water during normal use. Environmental Science & Technology. Our summary
- Li D, Shi Y, Yang L, Xiao L, Kehoe DK, Gun'ko YK, Boland JJ, Wang JJ (2020). Microplastic release from the degradation of polypropylene feeding bottles during infant formula preparation. Nature Food. Our summary
- Gerhard MN, Schymanski D, Ebner I, Esselen M, Stahl T, Humpf HU (2022). Can the presence of additives result in false positive errors for microplastics in infant feeding bottles?. Food Additives & Contaminants: Part A.
- Hussain KA, Romanova S, Okur I, et al. (2023). Assessing the release of microplastics and nanoplastics from plastic containers and reusable food pouches: Implications for human health. Environmental Science & Technology. Our summary
- Alin J, Hakkarainen M (2011). Microwave heating causes rapid degradation of antioxidants in polypropylene packaging, leading to greatly increased specific migration to food simulants as shown by ESI-MS and GC-MS. Journal of Agricultural and Food Chemistry.
- Jin T, Liu Y, Lyu H, He Y, Sun H, Tang J, Xing B (2024). Plastic takeaway food containers may cause human intestinal damage in routine life usage: microplastics formation and cytotoxic effect. Journal of Hazardous Materials.
- IARC Working Group on the Identification of Carcinogenic Hazards to Humans (2019). Styrene, Styrene-7,8-oxide, and Quinoline (IARC Monographs Volume 121). International Agency for Research on Cancer.
- Genualdi S, Nyman P, Begley T (2014). Updated evaluation of the migration of styrene monomer and oligomers from polystyrene food contact materials to foods and food simulants. Food Additives & Contaminants: Part A.
- Du F, Cai H, Zhang Q, Chen Q, Shi H (2020). Microplastics in take-out food containers. Journal of Hazardous Materials.
- Liu M, Brandsma SH, Schreder E (2024). From e-waste to living space: Flame retardants contaminating household items add to concern about plastic recycling. Chemosphere 365:143319 (corrected twice, December 2024 and July 2025). Our summary
- Samsonek J, Puype F (2013). Occurrence of brominated flame retardants in black thermo cups and selected kitchen utensils purchased on the European market. Food Additives & Contaminants: Part A.
- Guzzonato A, Puype F, Harrad SJ (2017). Evidence of bad recycling practices: BFRs in children's toys and food-contact articles. Environmental Science: Processes & Impacts.
- Le HH, Carlson EM, Chua JP, Belcher SM (2008). Bisphenol A is released from polycarbonate drinking bottles and mimics the neurotoxic actions of estrogen in developing cerebellar neurons. Toxicology Letters.
- Brede C, Fjeldal P, Skjevrak I, Herikstad H (2003). Increased migration levels of bisphenol A from polycarbonate baby bottles after dishwashing, boiling and brushing. Food Additives and Contaminants.
- US Food and Drug Administration (2014). Bisphenol A (BPA): Use in Food Contact Application. FDA (Information for Consumers).
- EFSA Panel on Food Contact Materials, Enzymes and Processing Aids (CEP) (2023). Re-evaluation of the risks to public health related to the presence of bisphenol A (BPA) in foodstuffs. EFSA Journal.
- Food Packaging Forum (2024). European Commission bans bisphenol A in food contact materials. Food Packaging Forum (news).
- Bittner GD, Yang CZ, Stoner MA (2014). Estrogenic chemicals often leach from BPA-free plastic products that are replacements for BPA-containing polycarbonate products. Environmental Health.
- Zimmermann L, Dombrowski A, Völker C, Wagner M (2020). Are bioplastics and plant-based materials safer than conventional plastics? In vitro toxicity and chemical composition. Environment International.
- Sanllorente S, Sarabia LA, Ortiz MC (2016). Migration kinetics of primary aromatic amines from polyamide kitchenware: Easy and fast screening procedure using fluorescence. Talanta.
- IARC Monographs programme (2024). Volume 136: Talc and acrylonitrile. IARC Monographs news, 5 July 2024.
- Rudel RA, Gray JM, Engel CL, Rawsthorne TW, Dodson RE, Ackerman JM, Rizzo J, Nudelman JL, Brody JG (2011). Food packaging and bisphenol A and bis(2-ethylhexyl) phthalate exposure: findings from a dietary intervention. Environmental Health Perspectives.
- US Food and Drug Administration (2024). Recycled Plastics in Food Packaging. FDA guidance page.
Spotted an error? Tell us and we'll correct it and note the change.