What's actually in the ocean: garbage patches, fishing gear, rivers and cleanups
The garbage patch is mostly fishing gear, input estimates disagree a hundredfold, and 'more plastic than fish' rests on thin maths. What the research shows and what cuts inputs.
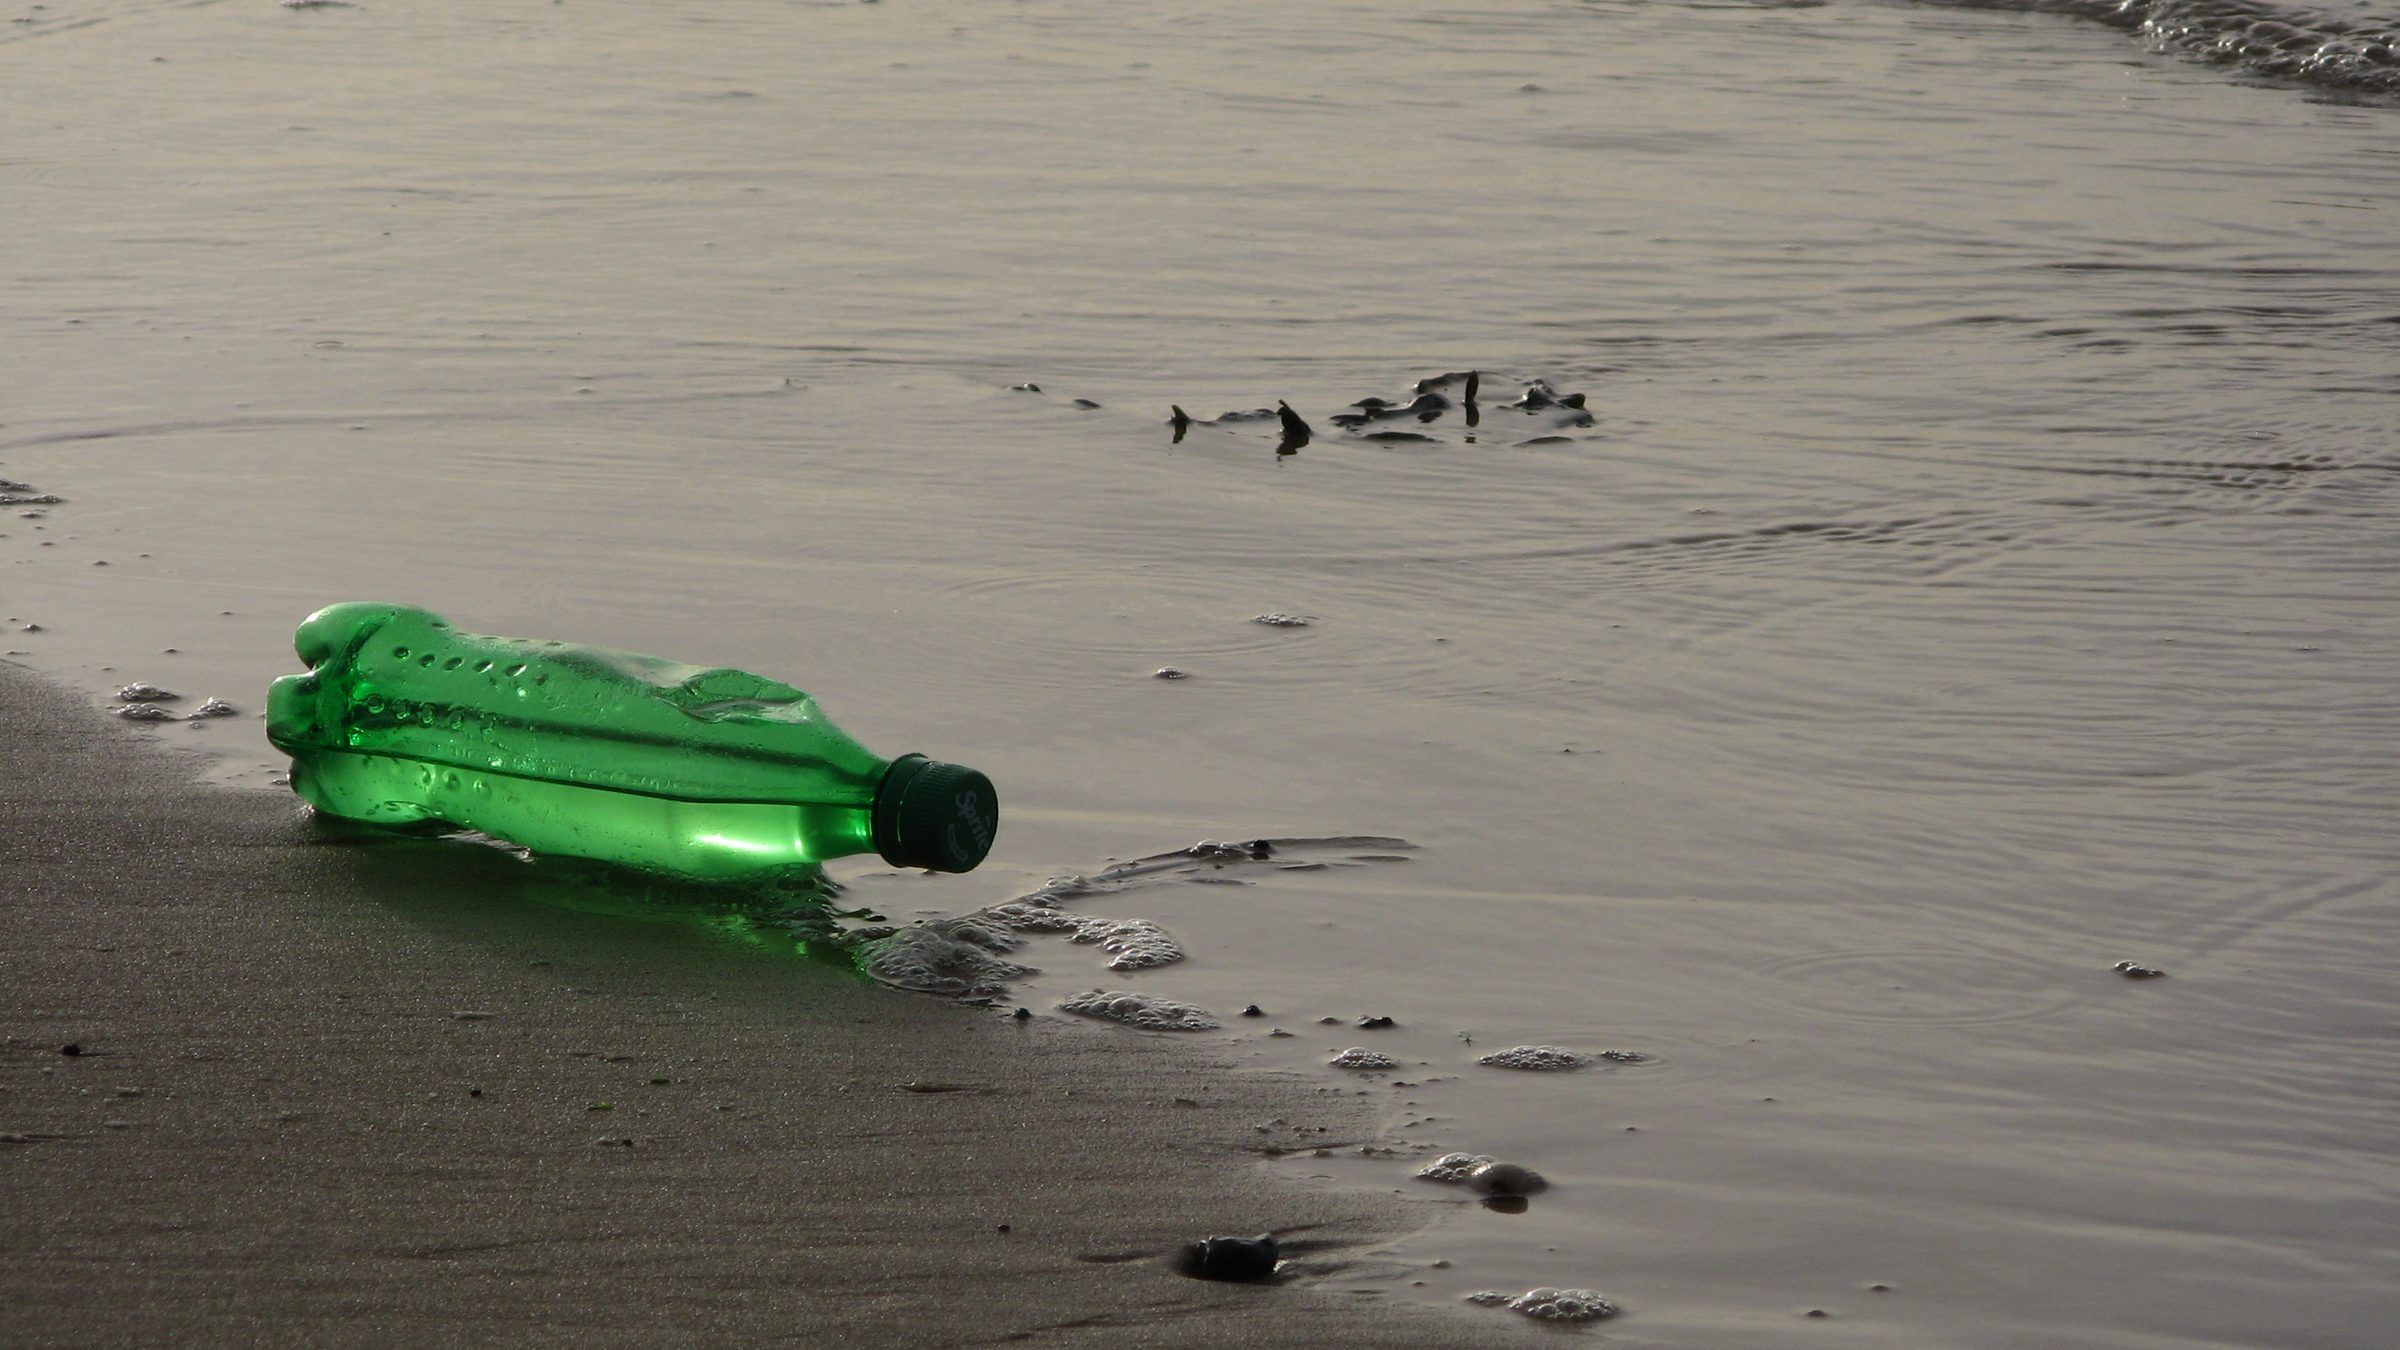
Picture the Great Pacific Garbage Patch and you probably see a floating island of shopping bags and water bottles. It isn’t an island, and it’s mostly not bags. Most of its weight is fishing nets, ropes, crates and buoys, much of it traceable to a handful of rich fishing nations.
That one fact upends a lot of the story we’ve been told about ocean plastic. Here’s what researchers have measured: how much plastic gets in, where it goes, whether the famous “more plastic than fish” line holds up, and whether the giant cleanup booms are worth the hype.
How much plastic gets into the ocean?
Nobody knows precisely, and the published estimates disagree by more than you’d think.
The figure that launched a thousand infographics came from a 2015 study by Jenna Jambeck and colleagues. Using waste, population and income data, they calculated that 192 coastal countries generated 275 million tonnes of plastic waste in 2010, and that 4.8 to 12.7 million tonnes of it entered the ocean. They also warned that without better waste management, the plastic available to leak would grow by an order of magnitude by 2025.
A larger 2020 team led by Stephanie Borrelle widened the lens to rivers and lakes as well as the sea. They estimated that 19 to 23 million tonnes, or 11% of all plastic waste generated in 2016, entered aquatic ecosystems, and that even if governments met their stated commitments, annual emissions could reach 53 million tonnes by 2030.
Those are estimates of what leaves the land, not what’s measured at sea. Keep that in mind, because it matters later.
Rivers: it’s not just ten big ones
For years a popular claim held that most river plastic came from about ten giant rivers, mostly in Asia and Africa. A 2021 model in Science Advances overturned that. It found more than 1,000 rivers account for 80% of global river plastic emissions, estimated at 0.8 to 2.7 million tonnes a year, and that small urban rivers are among the worst. Emissions turned out to be spread across up to a hundred times more rivers than earlier work suggested.
Two caveats. The lead author was at The Ocean Cleanup, which builds river barriers, so the finding fits its business model (it’s also well calibrated with field data and widely cited). And “where plastic leaks” isn’t the same as “who made it”. Rivers in places with weak waste collection leak more, but a lot of the plastic that flows through them was designed, sold and in some cases exported as “recycling” by companies and countries elsewhere.
What’s actually in the garbage patch
The Great Pacific Garbage Patch sits between California and Hawaii, where currents gather floating debris. A 2018 survey using ships and aircraft estimated it held at least 79,000 tonnes of plastic (range 45,000 to 129,000) across 1.6 million square kilometres. Over three-quarters of that mass was debris larger than 5 cm, and at least 46% was fishing nets. Microplastics made up just 8% of the mass but 94% of the estimated 1.8 trillion pieces. The authors concluded the patch was growing fast.
A follow-up in 2022 sorted more than 6,000 hard plastic items over 5 cm pulled from the patch in 2019. Where the country of origin could be identified, the top five were Japan (34%), China (32%), South Korea (10%), the United States (7%) and Taiwan (6%). Fishing and aquaculture items such as fish boxes, oyster spacers and eel traps made up 26% of the hard objects by count. Adding the nets and ropes, the authors estimated that 75 to 86% of the floating plastic mass over 5 cm could be abandoned, lost or discarded fishing gear. Their conclusion: most floating plastic in that gyre traces back to five industrialised fishing nations, which puts the fishing industry at the centre of the fix.
Two honest caveats here as well. The authors think some of Japan’s share is debris from the 2011 Tōhoku tsunami. And both garbage-patch papers come from researchers at The Ocean Cleanup (the 2018 one co-authored by founder Boyan Slat), which runs a cleanup operation in the very same patch.
How much gear goes missing? Interviews with fishers around the world, scaled up using global fishing effort data, suggest that nearly 2% of all fishing gear is lost to the ocean every year, including about 740,000 km of longline and more than 25 million pots and traps. That’s an estimate built on what fishers report, so it’s more likely to be low than high.
Near shore, it’s your takeaway
The garbage patch isn’t the whole ocean. A 2021 study combining litter surveys from seven kinds of aquatic environments found that take-out food and drink packaging dominates litter worldwide, followed by fishing items. Their explanation is a sorting system: bags, bottles and wrappers mostly get trapped near the coast, on beaches and in shallow water. What escapes to the open ocean is mostly small fragments, plus the gear that was already out there. So both stories are true. On your beach, it’s cups and wrappers. Out in the gyre, it’s nets.
The plastic smog
Between the big debris and the nanoplastics lies a haze of small floating fragments. A 2023 analysis of 11,777 sampling stations from 1979 to 2019 estimated the ocean surface held 82 to 358 trillion plastic particles weighing 1.1 to 4.9 million tonnes. The trend was flat-ish until 1990, wobbled until 2005, then climbed fast. The paper’s title rounds this to “over 170 trillion”. Counting particles at sea is notoriously messy (we explain why in how microplastics are measured), so treat the range, not the midpoint, as the finding.
The case of the missing plastic
Here’s the puzzle. If millions of tonnes enter the ocean every year, and surveys only find tens of thousands to a few million tonnes floating, where’s the rest?
For years researchers hunted for a “missing sink”: sinking to the seafloor, washing up on shores, being eaten, breaking into pieces too small to catch. Then the question flipped. Maybe the inputs were too high.
- A 2021 reanalysis of microplastic data argued that river flux estimates were overestimated by two to three orders of magnitude, which would mean plastic lingers on the surface for years rather than days. This is about microplastics specifically and remains contested.
- A 2023 global mass budget in Nature Geoscience fed observations from coastlines, the surface and the deep ocean into one model. It estimated about 3,200 thousand tonnes of buoyant plastic in the ocean in 2020, more than 95% of it larger items over 25 mm, with about 500,000 tonnes a year coming in. With those numbers, the authors say there’s no missing sink. They also say the total is still rising.
So which is right: about 0.5 million tonnes a year or 19 to 23 million? They aren’t measuring the same thing. The big numbers estimate mismanaged waste reaching any water, including rivers, lakes and coasts where much of it sinks or strands. The small number tracks buoyant plastic that stays in the marine system long enough to be modelled. The gap tells you most leaked plastic ends up somewhere other than floating at sea, not that the problem is a hundred times smaller.
What everyone agrees on: big floating debris persists for decades, it keeps breaking down into smaller pieces, and the total is growing.
“More plastic than fish by 2050”: where it came from
This line has been on t-shirts, in speeches and in a lot of our old posts. It traces to The New Plastics Economy, a 2016 report by the World Economic Forum, the Ellen MacArthur Foundation and McKinsey, developed with more than 40 participating companies and cities.
To their credit, the authors published a background note explaining their maths. It’s worth reading, because it shows how thin the claim is:
- The starting stock was an estimate, not a measurement. They began with 150 million tonnes of plastic already in the ocean, taken from a 2015 Ocean Conservancy and McKinsey report.
- The future was compound interest. They took Jambeck’s middle estimate of annual inputs, grew it 5% a year to 2025, then grew it at forecast global GDP growth (3.5%) to 2050. That gave 850 to 950 million tonnes by 2050. By our arithmetic, you only get there by adding every year’s inflow to the starting stock and removing nothing for plastic that washes ashore or breaks down.
- Fish were frozen in time. They compared that with 812 to 899 million tonnes of fish, taken from the same Ocean Conservancy report and a 2008 model by Simon Jennings and colleagues. The note says plainly that these are fish stocks today, with no adjustments made for 2050 and the effects of overfishing “not taken into account”.
- Fish biomass is very uncertain. A 2014 acoustic study suggested the roughly 1,000 million tonnes then estimated for mesopelagic fish alone (the small fish of the ocean’s twilight zone) should be revised to at least ten times higher. If that’s even roughly right, the comparison falls apart.
And compare the starting point with today’s best budget: about 3.2 million tonnes of buoyant plastic. That isn’t directly comparable, since the 150 million tonnes was meant to include sunken plastic, but it shows how far the headline rested on assumptions rather than what’s been found at sea.
Our verdict: it’s a projection built on a projection, compared with a number held artificially constant. The underlying point, that plastic leakage is growing faster than our ability to stop it, is well supported by Borrelle and colleagues. The fish comparison isn’t. Stop using it. You don’t need it.
Cleanups: what’s been removed versus what’s going in
The Ocean Cleanup is the Dutch nonprofit founded by Boyan Slat, best known for giant floating barriers towed through the garbage patch, and for solar-powered “Interceptor” barges in rivers.
Here’s what its own figures say. As of 20 October 2026, its dashboard reports about 67 million kg of trash removed in total, most of it from rivers, with about 3.6 million kg in the previous 30 days. Its oceans page says it has caught almost 500,000 kg of trash in the Great Pacific Garbage Patch. Its stated goal is to remove 90% of floating ocean plastic by 2040. It also claims its river work stops 2 to 5% of global river plastic emissions. None of this is independently audited, and “trash” includes things that aren’t plastic.
Now set those numbers against the research:
- In the patch: almost 500 tonnes removed, set against an estimated 79,000 tonnes there in 2018, which was growing. That’s roughly 0.6% of the 2018 stock, by our arithmetic.
- Everywhere: about 67,000 tonnes removed over the project’s lifetime, set against 19 to 23 million tonnes estimated to enter waterways in a single year. That’s roughly 0.3% of one year’s emissions.
River interceptors make more sense than ocean booms: catching plastic before it fragments and spreads is far cheaper than chasing it across 1.6 million square kilometres. But even there, the claim to stop 2 to 5% of river emissions comes from the company itself.
The critiques
- It treats the symptom. In a 2023 commentary, 15 plastics researchers argued that cleanup technologies can only temporarily ease plastic build-up locally, and that policy should prioritise cutting production upstream. Modelling backs them up: even with every feasible intervention, a 2020 study found 710 million tonnes of plastic would still enter the environment by 2040.
- Bycatch and the life on the surface. The open-ocean surface hosts drifting animals called neuston, such as by-the-wind sailors and violet sea snails. A 2023 study from Rebecca Helm’s lab found higher densities of floating life inside the garbage patch than on its edges, with abundance rising with plastic for three of five groups. A net that gathers plastic may gather them too.
- No rules. Researchers have called for cleanup technologies to be regulated, with impact assessments before deployment and documented bycatch and catch efficiency. Right now nobody has to prove a cleanup does more good than harm.
The Ocean Cleanup’s response: its FAQ says its most recent study found “no evidence of consistently elevated neuston abundance within the hotspots” it targets, and that it samples in front of and behind its systems. Its oceans page states that its research “showed that the benefits of cleaning the GPGP outweighed potential environmental costs, including greenhouse gas emissions and ecosystem disruptions.” It also argues that both legacy cleanup and stopping inputs are needed. Fair enough. The problem is scale, not sincerity: at current rates, the tap is still running far faster than the mop.
What actually reduces inputs
Ranked by strength of evidence:
- Make and use less plastic, especially single-use packaging. Every scenario model points here. The 2020 Science study found the biggest cuts came from combining reduced consumption, reuse, better collection and recycling, and safe disposal, which together could cut plastic pollution by 78% versus business as usual by 2040. Borrelle’s team concluded that extraordinary efforts to transform the plastics economy are needed, not tweaks. Strong evidence.
- Collect waste where it isn’t collected. Leakage tracks waste management quality, as both Jambeck and the river model show. Funding collection in fast-growing coastal cities, and stopping rich countries from exporting their plastic waste there, are among the most direct levers. Strong evidence.
- Hold the fishing industry responsible for its gear. Dumping plastic and fishing gear from ships has been banned under MARPOL Annex V since 1988; the garbage patch shows how well that’s enforced. The EU now requires extended producer responsibility for fishing gear containing plastic, making gear makers pay for collection. Gear marking, port reception facilities and deposit schemes for nets aim at the roughly 2% of gear lost every year. Good evidence on the problem; less on which policy works best.
- Catch it in rivers and on coasts. Interceptors, booms and beach cleanups remove plastic before it fragments. Useful locally, measurable, and a source of data. Moderate evidence; small scale.
- Chase it across the open ocean. Lowest return per tonne, with unresolved bycatch questions. Weak evidence of net benefit at scale.
What you can do
- Cut takeaway packaging. It’s the single biggest category of litter near shore. Bring a cup, a box, or eat in.
- Ask where your fish comes from. Supporting fisheries with gear-recovery programmes, and pressing retailers on gear loss in their supply chains, targets the garbage patch’s biggest ingredient. This is a lever with weak direct evidence; it’s about pressure, not personal footprint.
- Back production limits and producer responsibility in your city, state or country, for packaging and fishing gear. That’s where the evidence says the biggest wins are. And don’t let anyone tell you this is mainly about your littering; that framing was manufactured.
- Join or fund a river or beach cleanup, ideally one that records what it finds. The data helps hold brands to account.
- Stop sharing “more plastic than fish”. The real numbers are bad enough.
For how we judge claims and sources, see our standards.
Sources
- Jambeck JR, Geyer R, Wilcox C, Siegler TR, Perryman M, Andrady A, Narayan R, Law KL (2015). Plastic waste inputs from land into the ocean. Science.
- Borrelle SB, Ringma J, Law KL, Monnahan CC, Lebreton L, et al. (2020). Predicted growth in plastic waste exceeds efforts to mitigate plastic pollution. Science.
- Meijer LJJ, van Emmerik T, van der Ent R, Schmidt C, Lebreton L (2021). More than 1000 rivers account for 80% of global riverine plastic emissions into the ocean. Science Advances.
- Lebreton L, Slat B, Ferrari F, Sainte-Rose B, Aitken J, et al. (2018). Evidence that the Great Pacific Garbage Patch is rapidly accumulating plastic. Scientific Reports.
- Lebreton L, Royer SJ, Peytavin A, Strietman WJ, Smeding-Zuurendonk I, Egger M (2022). Industrialised fishing nations largely contribute to floating plastic pollution in the North Pacific subtropical gyre. Scientific Reports.
- Richardson K, Hardesty BD, Vince J, Wilcox C (2022). Global estimates of fishing gear lost to the ocean each year. Science Advances.
- Morales-Caselles C, Viejo J, Martí E, González-Fernández D, et al. (2021). An inshore–offshore sorting system revealed from global classification of ocean litter. Nature Sustainability.
- Eriksen M, Cowger W, Erdle LM, Coffin S, Villarrubia-Gómez P, et al. (2023). A growing plastic smog, now estimated to be over 170 trillion plastic particles afloat in the world's oceans—Urgent solutions required. PLOS ONE.
- Kaandorp MLA, Lobelle D, Kehl C, Dijkstra HA, van Sebille E (2023). Global mass of buoyant marine plastics dominated by large long-lived debris. Nature Geoscience.
- Weiss L, Ludwig W, Heussner S, Canals M, Ghiglione JF, Estournel C, Constant M, Kerhervé P (2021). The missing ocean plastic sink: Gone with the rivers. Science.
- World Economic Forum, Ellen MacArthur Foundation, McKinsey & Company (2016). The New Plastics Economy: Rethinking the future of plastics. Background to key statistics from the report. Ellen MacArthur Foundation.
- Irigoien X, Klevjer TA, Røstad A, Martinez U, Boyra G, et al. (2014). Large mesopelagic fishes biomass and trophic efficiency in the open ocean. Nature Communications.
- The Ocean Cleanup (2026). Dashboard: kg of trash removed, and counting. The Ocean Cleanup (own data).
- The Ocean Cleanup (2026). Oceans. The Ocean Cleanup (own website).
- The Ocean Cleanup (2026). About us. The Ocean Cleanup (own website).
- The Ocean Cleanup (2026). Does our cleanup in the Great Pacific Garbage Patch (GPGP) pose a risk to marine surface life like neuston?. The Ocean Cleanup FAQ.
- Chong F, Spencer M, Maximenko N, Hafner J, McWhirter AC, Helm RR (2023). High concentrations of floating neustonic life in the plastic-rich North Pacific Garbage Patch. PLOS Biology.
- Falk-Andersson J, Rognerud I, De Frond H, Leone G, Karasik R, et al. (2023). Cleaning Up without Messing Up: Maximizing the Benefits of Plastic Clean-Up Technologies through New Regulatory Approaches. Environmental Science & Technology.
- Bergmann M, Arp HPH, Carney Almroth B, Cowger W, Eriksen M, et al. (2023). Moving from symptom management to upstream plastics prevention: The fallacy of plastic cleanup technology. One Earth.
- Lau WWY, Shiran Y, Bailey RM, Cook E, Stuchtey MR, et al. (2020). Evaluating scenarios toward zero plastic pollution. Science.
- European Parliament and Council (2019). Directive (EU) 2019/904 on the reduction of the impact of certain plastic products on the environment. Official Journal of the European Union.
- International Maritime Organization (2026). Prevention of Pollution by Garbage from Ships (MARPOL Annex V). IMO.
Spotted an error? Tell us and we'll correct it and note the change.